At MartelTurnkey, we are committed to doing business with honesty, truthfulness and transparency. One of the ways that we strive to honor that commitment is by providing financials about our available turnkey rentals on our website. Anyone who is interested in delving into the financials can access them with a few clicks. You don’t have to be a member, you don’t have to be preapproved and you don’t have to go through a lengthy telephone conversation in order to be vetted. All anyone needs to do is click to download, and the financial spreadsheets will arrive in your inbox for you to peruse at your leisure. If you’re interested, following is a handy guide to reading our turnkey rental financials.
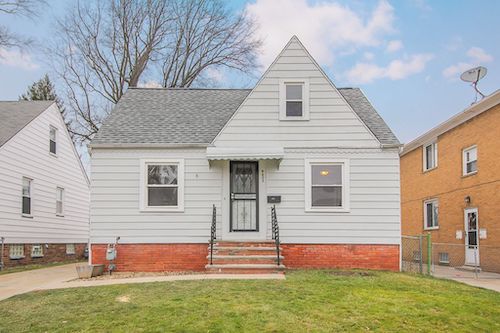
For the purposes of this guide, we’ll be looking at the spreadsheets for a turnkey rental property located at 5037 Greenhurst Drive in Maple Heights, Ohio. Maple Heights is a bedroom community of Cleveland, Ohio with about 23,000 residents, located in Cuyahoga County.
When you first receive the email after clicking the “Download Financials” button, you’ll be presented with a link that will take you to the Google Doc spreadsheets for all of our available turnkey rentals. You’ll see that the Greenhurst Drive property is one of the available properties listed. The first thing to notice is the three tabs at the bottom. Begin with the Summary Page.
The Summary Page Tab
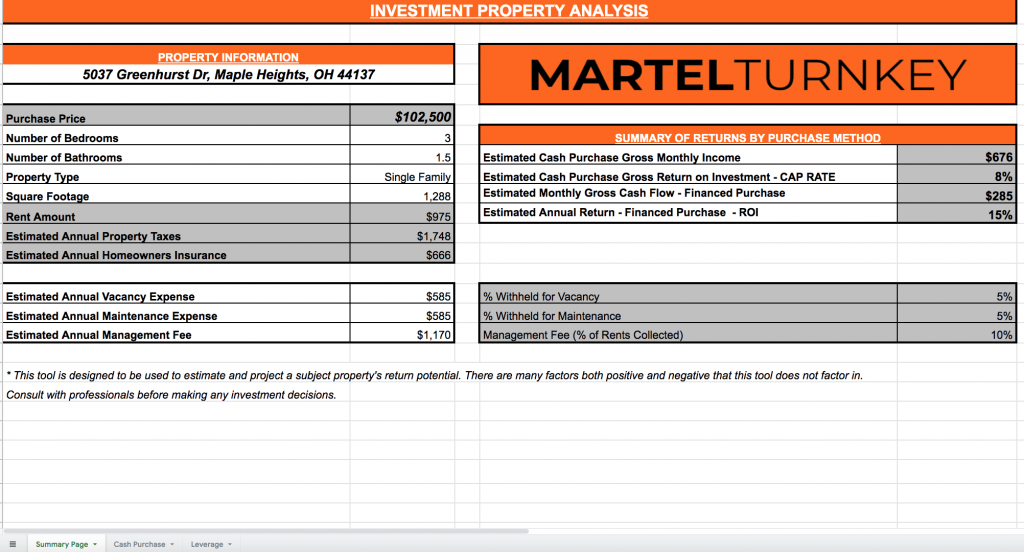
To better understand how these figures are calculated, look directly over to the right at the greyed out box where you can see lines for percentages withheld for vacancy, maintenance and management at 5%, 5% and 10%, respectively.
Typically, landlords are advised to hold back a certain amount of the rental income each month to budget for these three things. These three percentages represent the percentage of the rent amount.
Eventually down the line you’re going to have a vacancy in your property. For instance, if your tenant moves out December 31st, your property management company is going to clean up the property, take care of any needed repairs, take new photos, list it for rent again, etc. Somebody might move in on January 15th, but you’ll still have a vacancy for those two weeks in January. With single-family homes, many tenants end up staying for two or three years, but vacancies do still occur at some point. Vacancy hold back allotment is 5% which is the equivalent to two weeks of vacancy each year.
Also, over the course of a year you may have other maintenance needs; a towel bar comes off the drywall or a toilet part needs to be replaced; things like that. Recommended hold back allotment is 5%.
Management fee percentage is at 10% because that’s how much property managers charge of the rent.
So vacancy and maintenance percentage amounts are the amounts that the owner should retain out of the rental income so that these costs can be handled out of reserves when the time comes. The 10% management percentage covers the cost of the property management company and is included in the ROI.
The Vacancy and Maintenance expenses aren’t a true cost; look at it like a reserve bank account. It’s listed here so that prospective investors can better evaluate the earning potential of a property and be conservative in their evaluations.
Next, let’s take a look at the Cash Purchase tab.
The Cash Purchase Tab
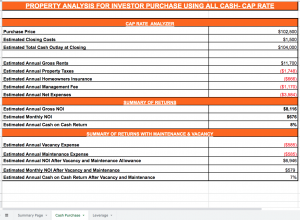
This offers financials for a situation where you’re not financing your turnkey rental purchase, which in our experience happens only about 1% of the time.
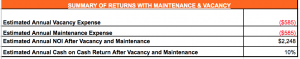
This spreadsheet is pretty self-explanatory; it offers a summary of returns both without maintenance and vacancy and Summary of Returns With Maintenance & Vacancy.
Note Lines 14 and 15, where it says Estimated Annual Gross Income NOI and Estimated Monthly NOI.
The Leverage Tab

The third spreadsheet is entitled Leverage, which represents the scenario used 99% of the time, where the buyer uses financing to buy a turnkey rental. The assumptions for the figures on this spreadsheet are that the buyer is putting 20% down and getting a low interest rate. In this example, the interest rate used is 4% over 30 years, as you can see in the top right-hand box labeled Loan Terms.
Real estate is not an exact science. So 15% is what you could get, but 10% is what you might get. The actual return will be somewhere in the middle.
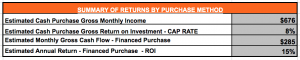
Overall, the numbers that you absolutely need to pay attention to are the Summary of Returns by Purchase Method on the Summary Page, which gives you your ROI and monthly cash flow whether you’re buying with cash or financing. The other very important number to pay attention to is the last number on the Leverage tab, which gives you your Cash on Cash return after any vacancies and maintenance. Then you can see both the best return possible and the possible return after vacancy and maintenance are factored in. You can then ask yourself, “Am I happy with this number landing somewhere between these two figures?” This approach helps you to set your expectations so that they are realistic.
Hopefully this little guide will help you to more easily read the financials for any property you’re considering with MartelTurnkey. But if you have any questions about the financials for any turnkey rental property, please don’t hesitate to reach out to us. We’re more than happy to clarify the figures and answer any questions you have.